Monitor and alert
Orion emits structured logs, Prometheus metrics, OpenTelemetry spans, and three health endpoints from the single binary. There are no sidecars or agents to deploy. This guide turns each one on, points it somewhere, and names the seven signals that fail silently.
Before you start
You need access to the instance’s config and somewhere to send each signal: a log sink, a Prometheus scraper, an OTLP collector. None of them is required; each section stands alone.
Structured logging
Choose a level and a format:
[logging]
level = "info"      # trace, debug, info, warn, error
format = "json"     # json for production, pretty for a terminal
JSON output goes straight into Loki, Datadog or CloudWatch without a parser. RUST_LOG gives per-crate control when you need it: RUST_LOG=orion=debug,tower_http=warn,sqlx=warn overrides the level above for the crates it names.
| Level | What lands here |
|---|---|
error | Failures that need attention |
warn | Degraded behaviour: circuit breakers opening, retries, dropped traces |
info | Request lifecycle, engine reloads, startup and shutdown |
debug | Per-connector calls, SQL, detailed processing |
trace | Fine-grained internal state |
Every request carries an x-request-id. Send your own or let Orion generate one. It appears in the logs and comes back on the response, which is how you join a user’s complaint to the lines that describe it.
Prometheus metrics
Turn on the exporter and give the scraper its own listener:
[metrics]
enabled = true
bind_addr = "127.0.0.1:9090"   # unauthenticated; the address is the access control
Scrape GET /metrics in Prometheus text format. With metrics.enabled = false the route is not registered at all, so /metrics answers 404. A deployment with metrics off cannot be mistaken for a working scrape target that happens to have no series.
bind_addr matters because /metrics is otherwise protected by admin_auth, and that same credential can rewrite workflows and read trace payloads. Setting it moves the endpoint onto its own plain-HTTP listener and removes it from the main one.
Every series carries the orion_ prefix, and in cluster mode an instance label naming the replica. Histograms export explicit buckets, so histogram_quantile() aggregates correctly across replicas. Names, types and labels are in Metrics.
Where a slow request goes
Three histograms nest, and subtracting them attributes latency without turning on per-request tracing:
# Engine overhead: condition evaluation, group gating, loop bookkeeping,
# audit writes; everything the engine does that is not a task body.
  sum(rate(orion_workflow_duration_seconds_sum[5m])) by (workflow)
- sum(rate(orion_task_duration_seconds_sum[5m]))     by (workflow)
orion_task_duration_seconds covers every dispatched task, including the engine’s own data functions (map, filter, parse_json, …) that no connector metric can see. orion_connector_request_duration_seconds is the narrower view of the same work, keyed by connector rather than by task. Subtracting it from the task total separates time spent talking to a backend from time spent shaping data.
A workflow skipped by its condition or rollout gate records nothing, so the count of orion_workflow_duration_seconds is workflow runs, not match attempts. A looping workflow records once for the whole loop rather than once per sweep.
What to alert on
Seven signals get missed because nothing fails loudly when they fire:
- Background jobs stall silently. Trace cleanup and DLQ retry swallow per-tick errors by design. Alert on
time() - orion_job_last_success_timestamp_seconds{job="…"}exceeding a few tick intervals, not on an error rate, which stays at zero. - DLQ depth goes stale when retry is off.
orion_trace_dlq_depthis refreshed by the retry loop. Withtrace_queue.dlq_retry_enabled = falseit stops updating, so a flat line is not an empty queue. - Any dropped audit event is a hole in the trail. Alert on
orion_audit_events_dropped_totalexisting at all, not on a threshold. - Lost trace writes have exactly one signal.
orion_trace_persistence_failures_totalcounts writes that never happen. Those rows are gone; nothing retries them later. - Kafka throttling is not loss. A sustained
kafka_guard_deferredrate inorion_errors_totalmeans channel guards are throttling the topic. Offsets stay uncommitted and records retry, so this shows up as lag rather than errors. - A schedule falling behind fails no liveness check. Every component is working; occurrences are produced faster than they are run. Alert on the high quantiles of
orion_cron_schedule_lag_seconds, and onorion_cron_pending_occurrencesgrowing monotonically.orion_cron_lease_renewal_failures_totalis worth alerting on at any value: work was cancelled mid-run, and whether its side effects landed is unknowable from the metric. - A deprecated trace-token form is invisible until you look.
orion_trace_token_query_reads_totalcounts trace reads authorized by the?token=query parameter, which leaks into logs, history andRefererheaders. A sustained zero is what makes the parameter safe to remove, so alert on it being non-zero once you have migrated your callers.
Beyond these, alert on what every service needs: error rate by channel, P99 latency, and /readyz failures.
Distributed tracing
Export spans over OTLP:
[tracing]
enabled = true
otlp_endpoint = "http://localhost:4317"
service_name = "orion"
sample_rate = 1.0    # 0.0 (none) to 1.0 (all)
Spans export over OTLP gRPC to Jaeger, Tempo or any compatible collector, with channel, workflow and task attributes. Incoming traceparent headers are honoured and propagated into outbound http_call requests, so an Orion hop does not break a distributed trace, including through Kafka headers.
Note
Two sampling knobs, different jobs.
tracing.sample_rategoverns OTLP span export. Trace persistence sampling (trace_storage.sample_rate) applies to sync traces only. An async submission’s trace row is how its result reaches the caller, so async traces always persist; bound them witherrors_onlyortrace_queue.retention_hoursinstead. See Traces and async processing.
Health endpoints
Three endpoints answer three different questions:
| Endpoint | Question | Behaviour |
|---|---|---|
GET /healthz | Is the process alive? | Always 200 while the process runs. Liveness probe. |
GET /readyz | Should it receive traffic? | 200 only when the database is reachable, startup finished, no required background task has died, and, when enabled, cluster Redis answers and Kafka ingestion is not degraded. Readiness probe. |
GET /health | What is the state of each part? | Component-level status with degradation detail. |
Wire the first two into your orchestrator:
livenessProbe:
  httpGet: { path: /healthz, port: 8080 }
  initialDelaySeconds: 5
  periodSeconds: 10
readinessProbe:
  httpGet: { path: /readyz, port: 8080 }
  initialDelaySeconds: 5
  periodSeconds: 5
Warning
Point monitors at
/health’sstatusfield, not only at its HTTP code. A failing database answers503with"status": "degraded". But a failed connector load, a quarantined channel, or a dead Kafka consumer also report"status": "degraded"at HTTP 200. The instance still serves traffic, and a503would eject a healthy node from its load balancer over a component nothing in flight may even use.
/health is deliberately two-tier. Anonymous callers get the coarse component states. Detail fields are served only when admin auth is disabled or the caller presents a valid admin key. Those are workflows_loaded, the per-connector circuit-breaker map, failed connector loads and quarantined channel names. A monitor can see that something is degraded without learning what.
components.cron appears only when this node has something to say about schedules. That is when the scheduler is on, or when it is off while an active cron channel is quarantined. It is degraded when the reconciler has not completed a pass for long enough that occurrences are being missed. It is also degraded when the scheduler is off while cron channels are stored active. Both are states in which every liveness signal is green and the declared schedules are not running. Like config_propagation it does not fail /readyz. The node still serves every request correctly, and removing it from the load balancer would not make a single occurrence run. See Cron occurrences.
components.kafka appears only when kafka.enabled is true. components.engine is a constant "ok", kept for response-shape stability: the engine snapshot cannot be unavailable once the process serves.
components.plugins and components.models each carry a third state, disabled, which is a configuration choice rather than a fault. The node has plugins.enabled or models.enabled off and serves everything else normally. Either reads degraded when an active row exists that this node could not carry. The causes: a missing artifact, a component that does not compile, a failed self-test, or a model whose admission never passed. The capability being off while active rows are stored counts too. components.models is also degraded while the admission worker is down, which is the state in which a new registration would wait for a verdict forever. Both are per node: the entity stays stored and active, and it is this node that cannot serve it.
Neither flips the top-level status on its own. They do not need to. A plugin or model that did not load quarantines the channels whose workflows use it, and components.channels is what carries that into status. Alert on components.channels for impact; read these two for the cause.
components.config_propagation
Cluster mode only. degraded means this node committed a change, applied it locally, and then failed to advance the shared config epoch. The other replicas have not been told. The request that made the change still succeeded, because it did. When a change does not propagate explains why that is a node-health signal rather than a client error. It clears on the next successful bump. /readyz is unaffected: this node is serving correctly, and ejecting it would not help the ones that are stale.
components.engine_reload
degraded means the last engine reload attempt failed. This node is still serving the previous generation of channels and workflows: correct, but no longer what the database says. It clears on the next successful reload.
The signal exists because nothing else reports it. An admin mutation that commits and then fails to reload answers 2xx, deliberately. The row is active and the next successful reload serves it. A 5xx would tell the client its change failed when it did not. The natural response, retrying, writes a second version or collides with the first. The same argument config_propagation makes for a lost epoch bump. The cluster epoch watcher’s resync has no caller to tell at all.
POST /api/v1/admin/engine/reload is the exception. A caller who asked for a reload is told when it failed, because there is no committed write for the error to misdescribe. /readyz is unaffected, for the same reason as config_propagation. This node is serving, only not the newest config, and ejecting it would trade a stale-config problem for an availability one.
components.background_tasks
The node’s long-lived tasks are supervised, and this is what they report:
| Value | Meaning | Effect on /readyz |
|---|---|---|
ok | Every task is running. | ready |
degraded | A task is being restarted after a failure, or a non-essential one has given up. | ready |
error | A task the node cannot work without has stopped for good. | not ready |
The essential ones are the trace dispatcher, the trace persistence workers, the audit writer, the DLQ retry consumer, and in cluster mode the epoch watcher. Each fails silently by nature. A dead persistence worker drops traces and counts them as queue overflow. A dead audit writer loses the record of every later admin mutation. A dead epoch watcher leaves the node serving the configuration it booted with. error takes the node out of rotation so the loss stops rather than continues unobserved.
The retention jobs (trace cleanup, audit-log cleanup) are the non-essential ones. A node that has stopped expiring old rows still answers every request correctly, so they show as degraded and readiness is unaffected.
With an admin credential, /health adds a background_tasks array naming each task, its state, and how many times the supervisor has restarted it. A running task with a non-zero restart count is the one worth alerting on: it is up now, and it has been failing.
For a running instance’s own view, GET /api/v1/admin/engine/status returns the version, uptime, workflow counts, and the channel list.
Verify
Scrape the metrics listener and probe readiness:
curl -s http://127.0.0.1:9090/metrics | grep -c '^orion_'
curl -s -o /dev/null -w '%{http_code}\n' http://localhost:8080/readyz
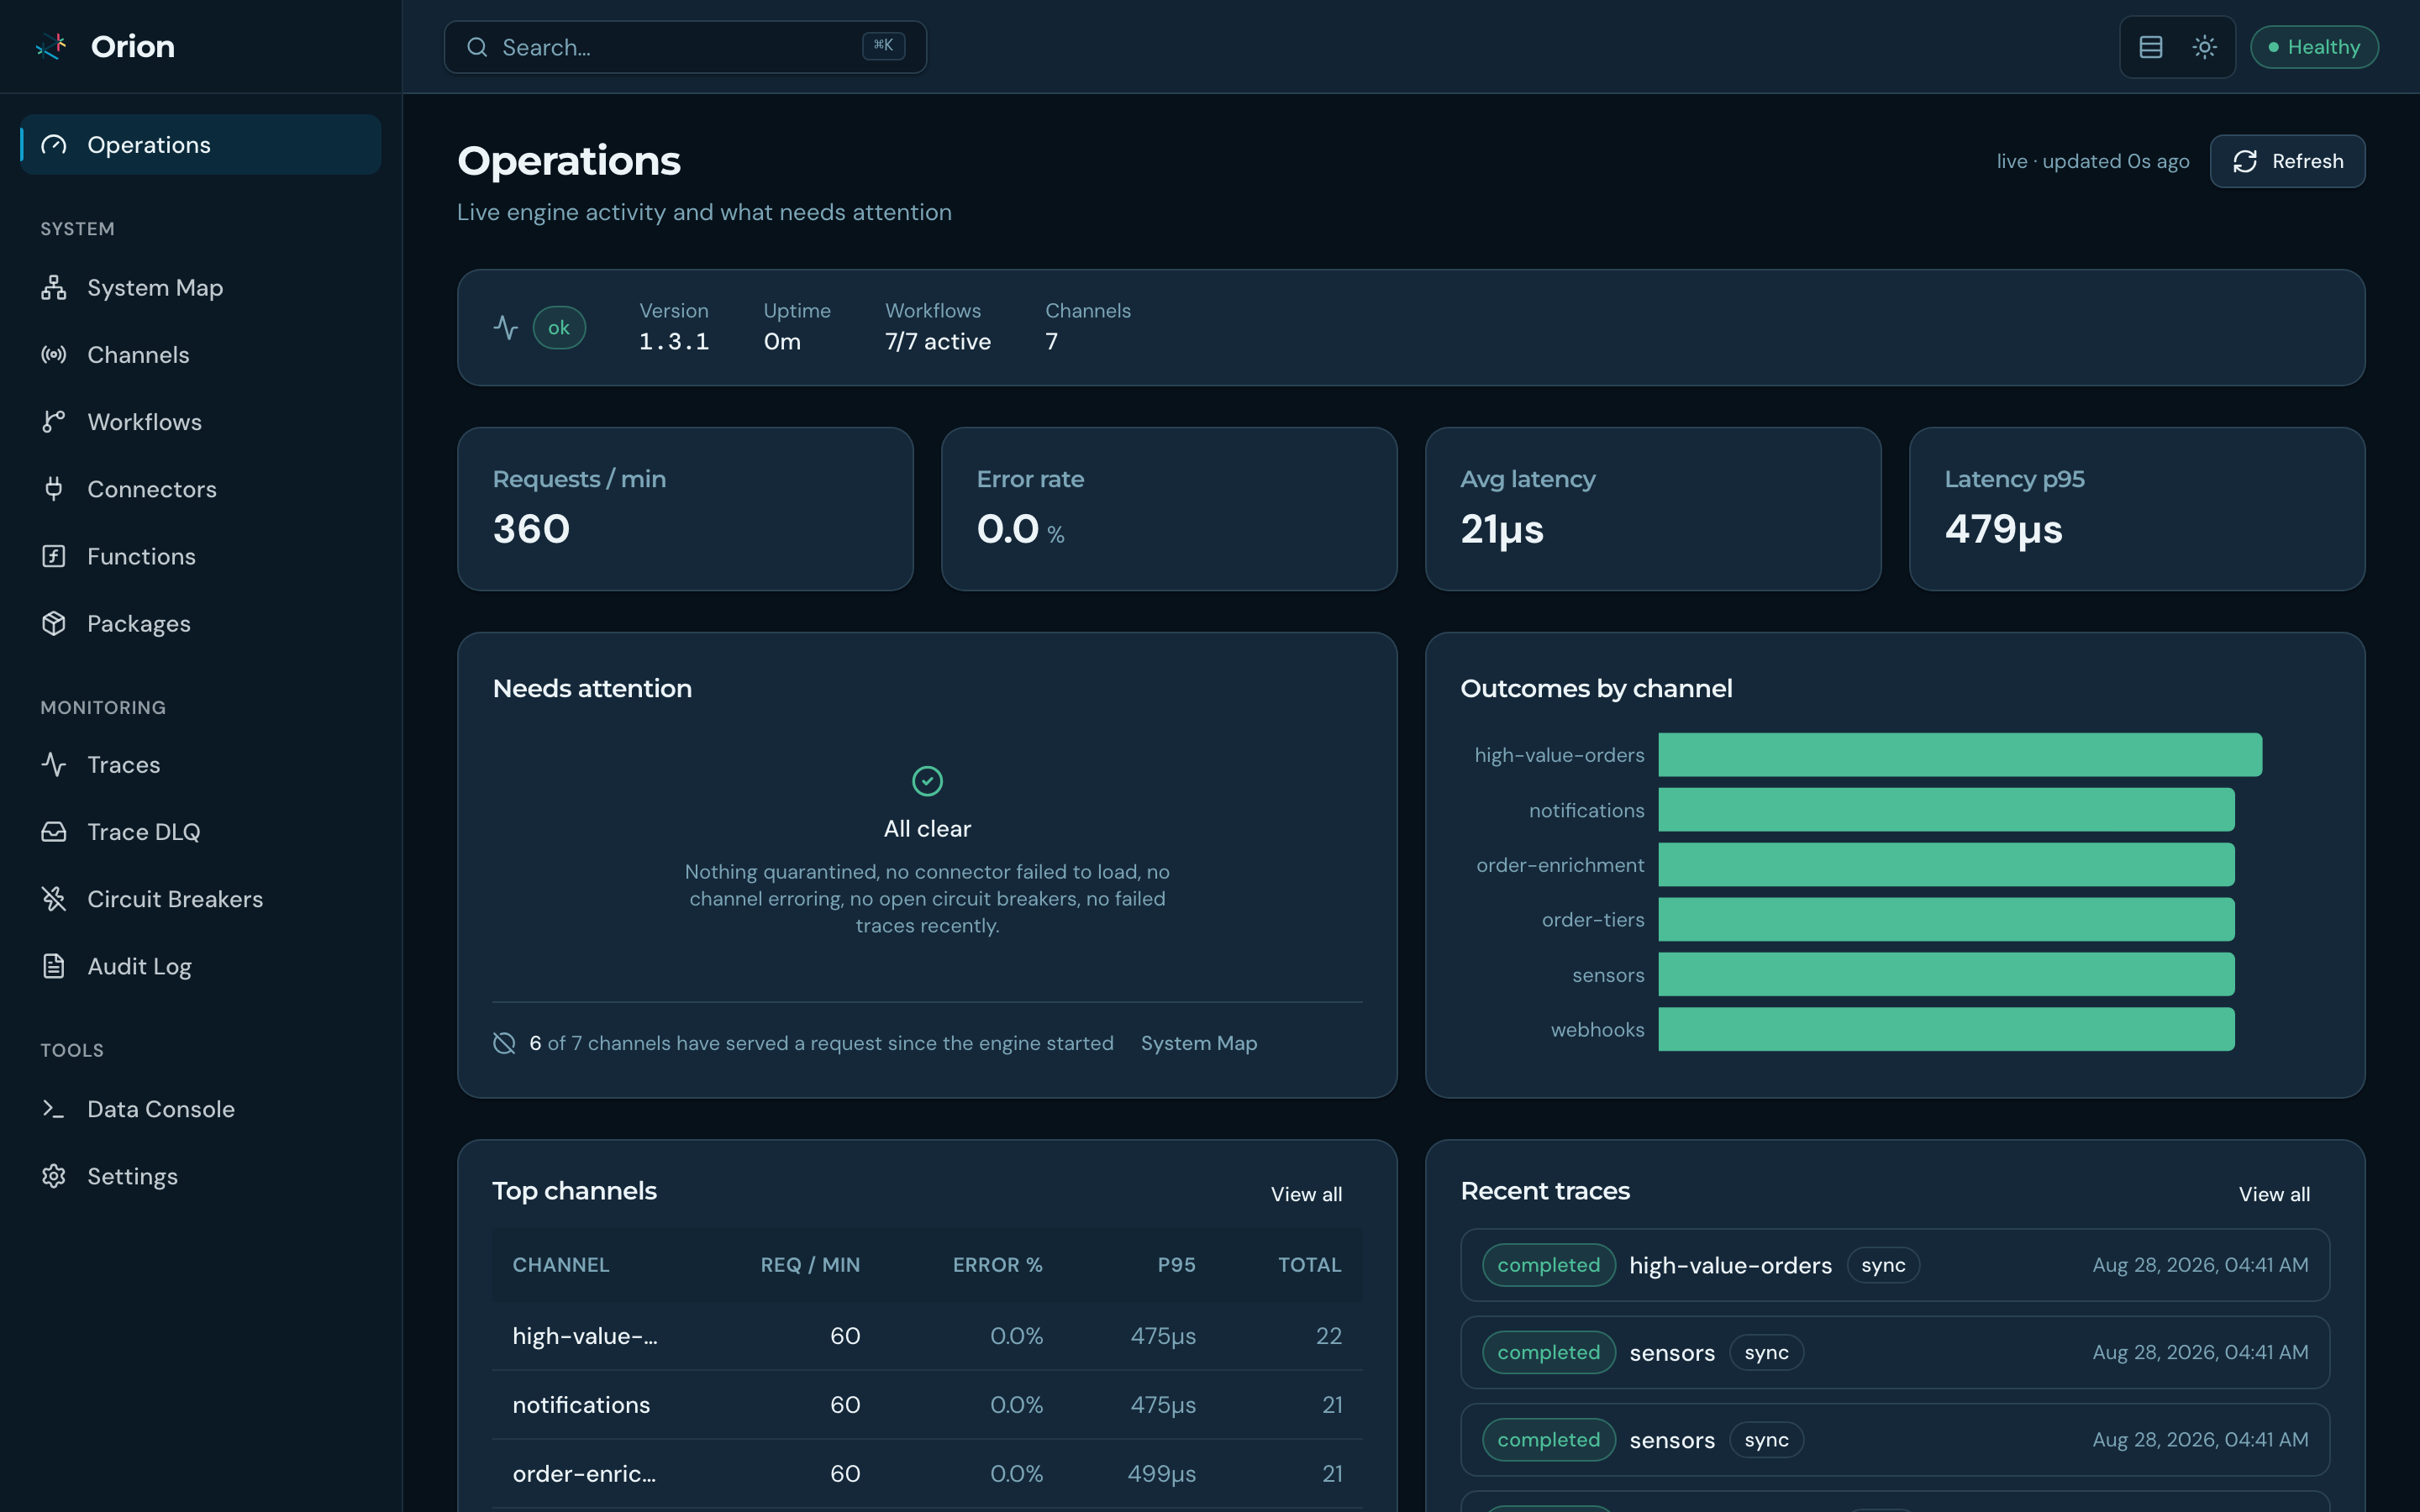
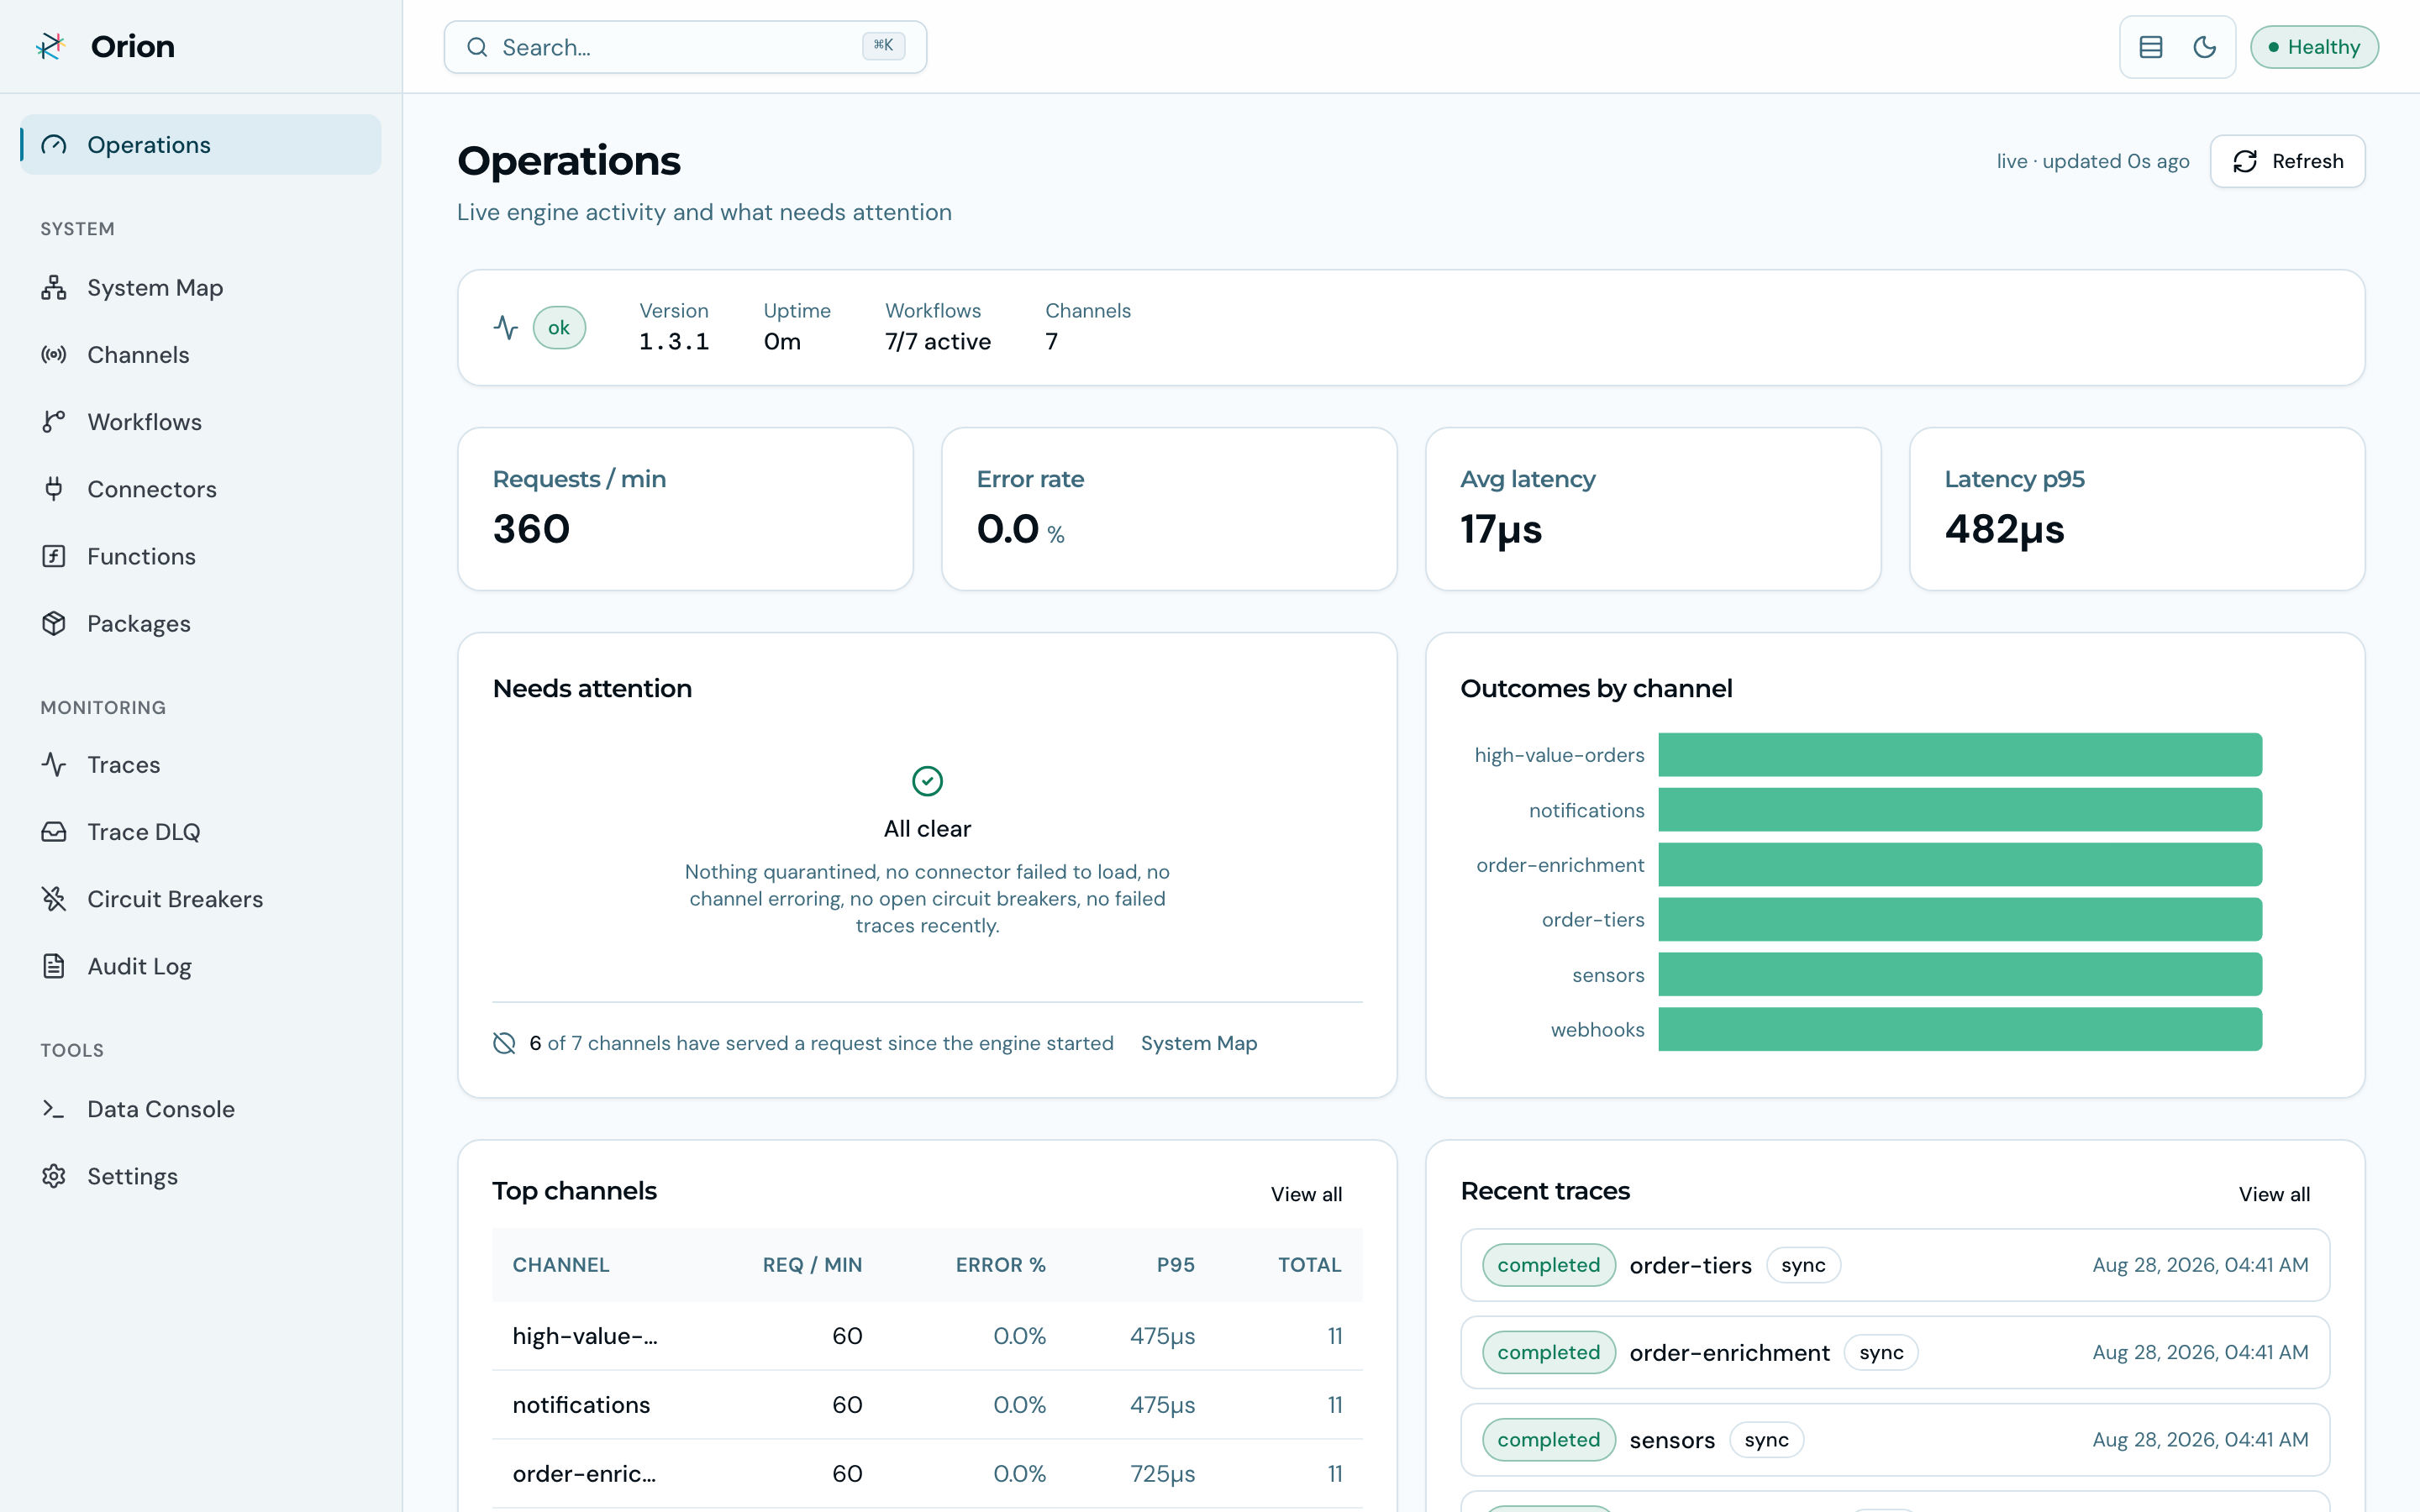
The first prints a count above zero; the second prints 200. Everything above also surfaces visually in the Orion Console: live request rate, error rate, latency percentiles, outcomes by channel, and trace drill-downs.
Next steps
- Metrics: every series, its type, and its labels.
- Traces and async processing: trace storage modes, the queue, and the DLQ.
- Troubleshooting: what to do when one of these signals fires.
- Configuration › Logging and metrics: the keys on this page, with defaults.
Last verified 14 September 2026